In an environment with stable inflation, the yield curve should typically be inverted.
Long term investors care about money when they retire, not next month. Most investors are long-term.
If inflation is steady, long-term bonds are a safer way to save money for the long run. If you roll over short-term bonds, then you do better when interest rates rise, and do worse when interest rates fall, adding risk to your eventual wealth. The long-term bond has more mark-to-market gains and losses, but you don't care about that. You care about the long term payout, which is less risky. (Throw out the statements and stop worrying.) So, in an environment with varying real rates and steady inflation, we expect long rates to be less than short rates, because short rates have to compensate investors for extra risk.
If, by contrast, inflation is volatile and real rates are steady, then long-term bonds are riskier. When inflation goes up, the short term rate will go up too, and preserve the real value of the investment, and vice versa. The long-term bond just suffers the cumulative inflation uncertainty. In that environment we expect a rising yield curve, to compensate long bond holders for the risk of inflation.
So, another possible reason for the emergence of a downward sloping yield curve is that the 1970s and early 1980s were a period of large inflation volatility. Now we are in a period of much less inflation volatility, so most interest rate variation is variation in real rates. Markets are figuring that out.
Most of the late 19th century had an inverted yield curve. UK perpetuities were the "safe asset," and short term lending was risky. It also lived under the gold standard which gave very long-run price stability.
(Yes, this argument is about portfolio variance, not beta, and assumes that the bond portfolio is a substantial part of the investor's wealth, or that inflation happens in bad times, at least over the investor's long horizon.)
***
This is a follow-up to low bond yields. That post has several good comments with links to the literature.
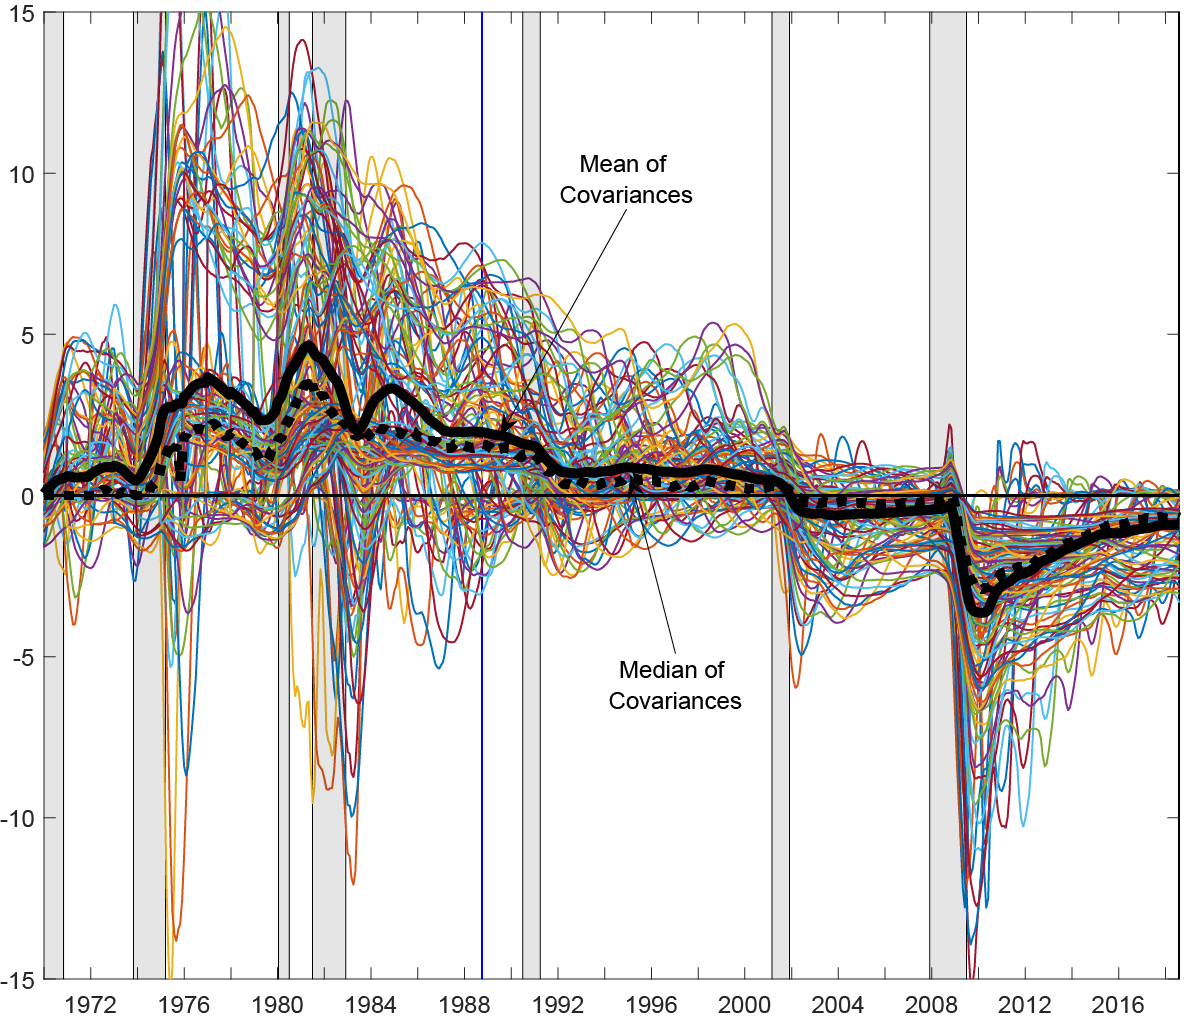
On that point, Uri Carl and Anthony Dierks send along this lovely graph from their note which makes the same point as my earlier blog post. The plot is different measures of the time-varying "covariance between Real Activity and Nominal Measures." The covariance changes sign, as I suspected.
from The Grumpy Economist https://ift.tt/2N7W0P7


0 comments:
Post a Comment